How can you NOT love a nine post series (so far) on Beer and IoT? There's IoT, devices, visualizations, math, formulas and beer!
Gunnar Peipman as been blogging up a storm on his Beer IoT project. Seriously, if you're into IoT, read his posts...
- Beer IoT: Building Universal Windows Application to monitor cooling process
- Beer IoT: Visualizing sensors data using Power BI
- Beer IoT: Using Stream Analytics to save data from IoT Hub to SQL database
- Beer IoT: Reporting measurements to Azure IoT Hub
- Beer IoT: Estimating beer cooling time
- Beer IoT: Making cooling rate calculation testable
- Beer IoT: Measuring cooling rate
- Beer IoT: Moving to ITemperatureClient interface
- Beer IoT: Measuring temperature with Windows 10 IoT Core and Raspberry Pi
Beer IoT: Measuring temperature with Windows 10 IoT Core and Raspberry Pi
I have RaspberryPi 2 with Windows 10 IoT Core and I plan to use it for some brewing activities. In this blog post I introduce you how to measure temperature with RaspberryPi using DS18B20 thermal sensors. This post is also example about how easy it is to get started with your IoT stuff using Microsoft tooling.
In practice I use this solution to monitor the freezing of eisbock beer. Making 20l of beer freeze takes time. Depending on weather outside it’s 10-18 hours. Using this solution I don’t have to open the bucket after every couple of hours to see if ice is coming and also I can estimate how long it takes for beer to freeze.
Electronics
I don’t stop here on deep details of my solution. It’s pretty easy if you know at least something about electronics. For electronics part I used blog post Thermal sensor connected via I2C by Tomáš Greňo. It describes all stuff in great detail and if you are using Linux on RaspberryPi then you can find there everything you need to read temperatures.
...
Wrapping up
Windows 10 IoT Core and Visual Studio tooling make it very easy to build IoT solutions. Of course, we don’t away from problems so easy like we did right now as there are no libraries for everything we want to do but still we have very good tooling that makes development way easier. Although we wrote temperature readings to debug window we can go further and send the values to some database or Microsoft Azure service.
Beer IoT: Estimating beer cooling time
In my last beer IoT post we measured out cooling rate of beer. In this post we try to estimate how long it takes for beer to start freezing. It’s actually simple calculation and we add it to our beer IoT background service before we focus on data reporting and persisting questions.
NB! In this post we are using code from beer IoT posts Measuring temperature with Windows 10 IoT Core and Raspberry Pi and Measuring cooling rate. Here we are making changes to already existing code.
In last post we calculated beer cooling rate that is constant through freezing process. We used the following equation with two temperature measurements:
We expect beer surface to start freezing when temperature inside bucket is 1°C. To calculate the estimate we have to do one little dirty trick. We take current beer temperature as initial one (T0) and constant temperature 1°C as T(t). Ambient temperature Ta will stay constant.
...

Beer IoT: Visualizing sensors data using Power BI
We are eager to try out our beer cooling solution and we want to see it in action. We want to visualize our data and keep eye on temperature of cooling beer. Before doing anything more complex like building web or mobile app we make a quick shortcut and bring our data to web, desktop and mobile. This post is about Power BI in action.
Building beer cooling report
Now let’s build beer cooling report. Log in to Power BI through your browser ańd under Datasets section on left select BeerIoT (this must be the name you gave to dataset when you added new output source to Stream Analytics job).
Select line chart under visualizations, drag it wider and configure it like shown on the screenshot below.
Click on somewhere on empty space near chart to get it out from focus and click on table under visualizations. Configure table like shown on the following screenshot.
Now save your report and name it as “Beer cooling” by example. Under reports menu on left select the report you just created. Click on pin button of line chart and add it to Beer IoT dashboard.
...


Beer IoT: Building Universal Windows Application to monitor cooling process
Our beer cooling solution is not controllable through IoT Hub and it reports data there. We can control our device through simple command line application but it is not enough for us. In this post we start building Universal Windows Application that helps us monitor temperatures. In this post we focus on mobile application.
This far we can visualize cooling process by connecting Excel to SQL Server or by using SQL Server Reporting Services (SSRS). Excel doesn’t show us real-time data if we don’t refresh data source manually. SSRS is total overkill for our scenario and here we don’t even consider it. As cooling may take hours we want something that we can take with us if we need to go out and mobile application is the perfect match for this need.
WARNING! I’m not specialist on XAML and mobile applications and therefore please forgive me if my XAML or coding strategy doesn’t survive any criticism. Of course, please feel free to point out my sad mistakes so I can improve my poor skills.
Building mobile application
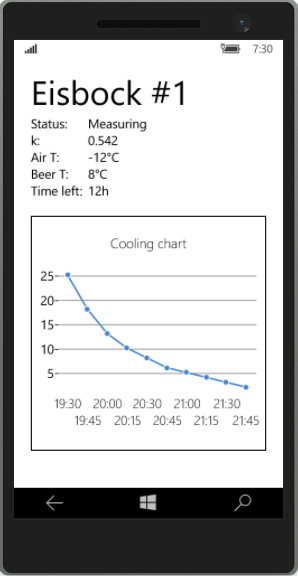
We want our application to be simple to use and we want it to show data. Let’s focus on showing data in this post. We build our application as Windows 10 Universal Application to later support also desktop client.
Image on right shows what will be the end result. To focus here on visualizing data we leave out reporting of cooling rate and cooling solution status. Initial and current temperatures we will get through Azure IoT Hub.
Our action plan here is simple:
- Create model for main view.
- Create main view with data and chart.
- Connect application to Azure IoT Hub.
I think for one post this is more than enough. If we generate more ideas for application then I can always write another post about it.
...
Follow @CH9
Follow @coding4fun
Follow @gduncan411


